
Climatology of Aerosol Optical Depth in North‐Central Oklahoma: 1992–2008
Submitter
Michalsky, Joseph J.
— NOAA/Earth System Research Laboratory/Global Monitoring Division & CU-Boulder/Cooperative Institute for Research in Environmental Sciences
Area of Research
Aerosol Properties
Journal Reference
Michalsky J, F Denn, C Flynn, G Hodges, P Kiedron, A Koontz, J Schlemmer, and SE Schwartz. 2010. "Climatology of aerosol optical depth in north-central Oklahoma: 1992–2008." 115(D7), D07203.
Science
Impact
The calibration technique used for the MFRSRs is based on a field technique described in the work of Michalsky et al. (JGR Atmospheres 2001). The 95% uncertainties using this technique are calculated to be in the range 0.01–0.02, which depends on successful Langley plots, which depend on the time of the year. Comparisons to daily averaged sun-pointing AERONET data from the site suggest biases less than 0.007 AOD. An improved cloud-screening technique increased the number of days per year with a reportable AOD average from 175 to 250 compared to a conservative screen used in an earlier paper. The daily averages plotted as a function of time of year suggest an August maximum and a December minimum. The Angstrom coefficient is a maximum in the summer (smaller aerosol sizes) and minimum in the winter (larger aerosol sizes). Over the 17-year record, the annual average Angstrom coefficient increases as Mt. Pinatubo aerosols were slowly removed from the stratosphere, reached their smallest sizes in the late 1990s, and have continued to slowly decrease in size to the end of 2008. The only interruption of this decreasing trend was in the summer of 2002, when forest fires were widespread throughout the western U.S.Summary
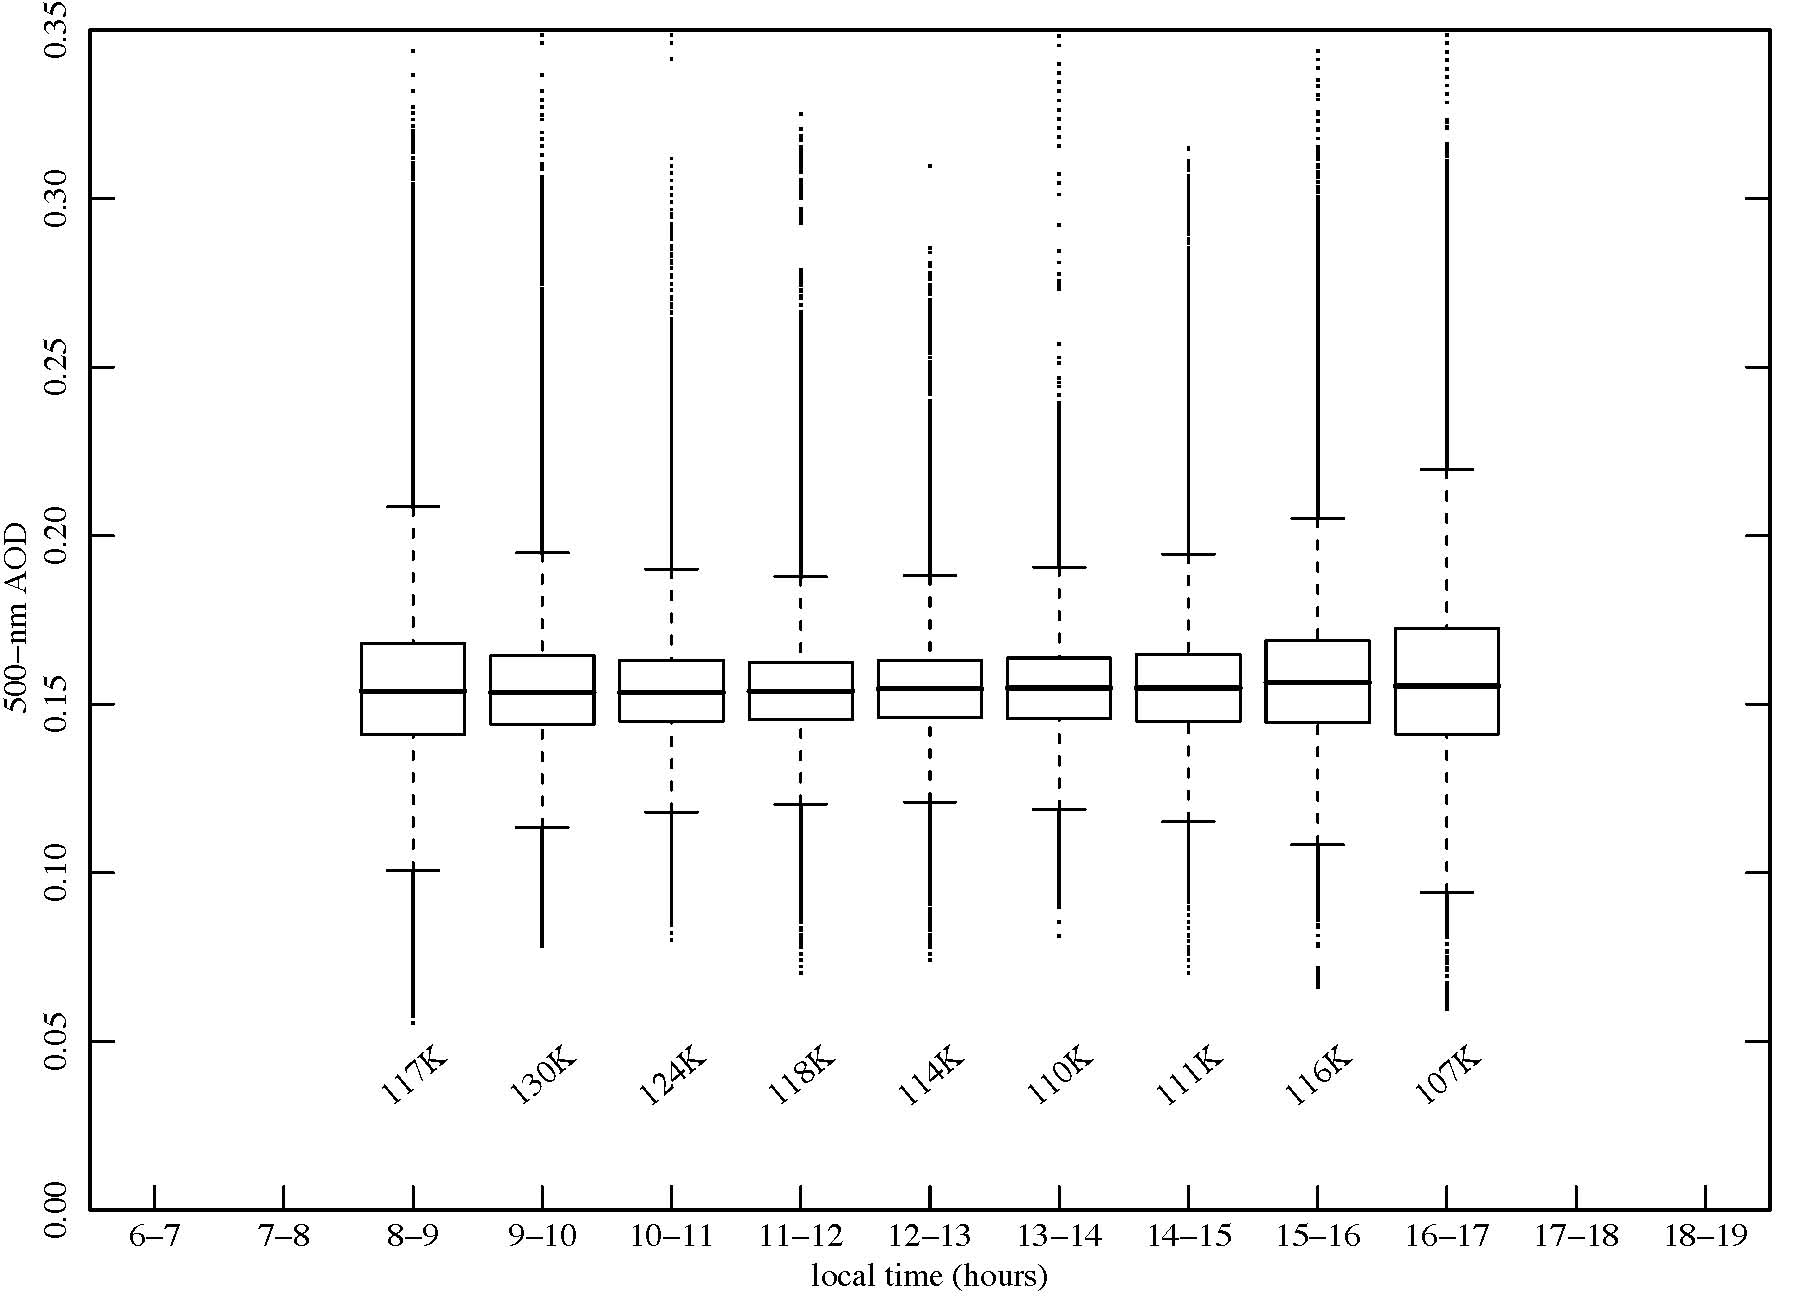
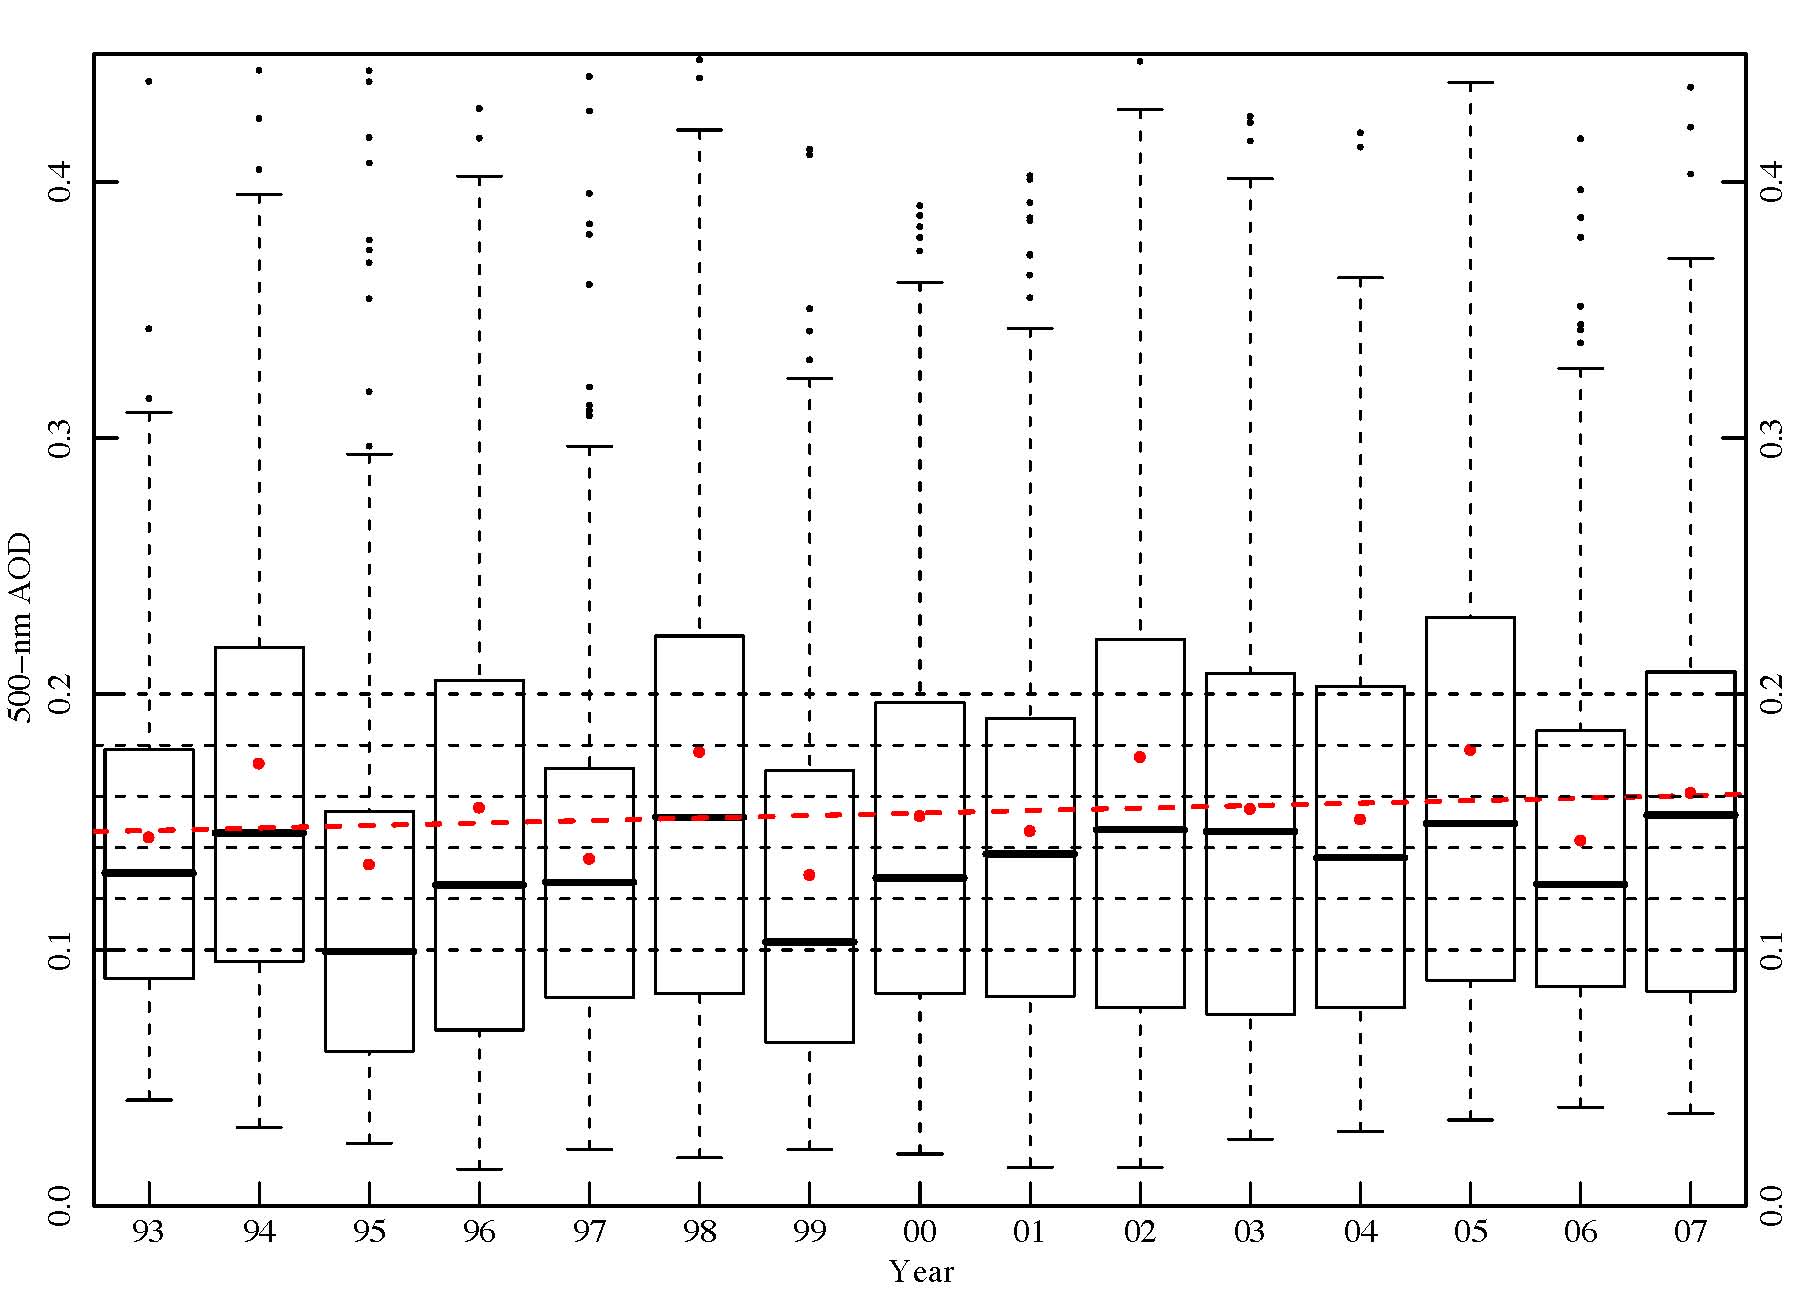
Annual averages of AOD, excluding the Mt. Pinatubo-influenced years, suggest a slight upward trend of around 0.0097 AOD per decade, but, unfortunately, with an uncertainty of 0.136 (Figure 1). Box plots of hourly data for each month for the entire period and box plots of all the hourly data in a 5-year period (Figure 2) suggest that there are no diurnal trends, monthly or annually, suggesting that single-point daily sampling (e.g., from a satellite) can, in principle, capture long-term trends in AOD. The more inclusive cloud screen and the use of the daylight hours with the sun above 9.25 degrees yielded a data set that can be used to more faithfully represent the true aerosol climatology for this site.Follow Us:


Keep up with the Atmospheric Observer
Updates on ARM news, events, and opportunities delivered to your inbox
ARM User Profile
ARM welcomes users from all institutions and nations. A free ARM user account is needed to access ARM data.


Atmospheric Radiation Measurement (ARM) | Reviewed
October 2024